Resistance Graph
Resistance Graph
Fig.1 Resistance Graph:
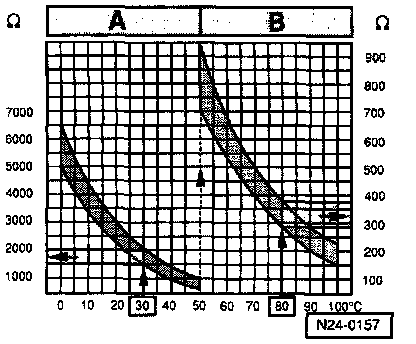
The diagram is valid for Engine Coolant Temperature (ECT) sensor -G62- and Intake Air Temperature (IAT) sensor -G72-.
Scale A shows resistance values for temperature range 0-50 °C (32-122 °F) and scale B the values for temperature range 50-100 °C (122-212 °F).
Examples:
- 30 °C (86 °F) corresponds to a resistance from 1500-2000 Ohms
- 80 °C (176 °F) corresponds to a resistance from 275-375 Ohms